| Annual CPI growth (%) | Annual Wage Growth (%) | Unemployment Rate (%) | ||||||
|---|---|---|---|---|---|---|---|---|
| Date | 1 year ahead | 2 years ahead | 5 years ahead | 10 years ahead | 1 year ahead | 2 years ahead | 1 year ahead | 2 years ahead |
| Previous years: | ||||||||
| Jun 2024 | - | - | - | - | - | - | - | - |
| Jun 2025 | 2.44 | 2.54 | 3.06 | 3.94 | 2.59 | 3.19 | 5.13 | 4.86 |
| Quarterly: | ||||||||
| Sept 2025 | 2.53 | 2.64 | 3.16 | 3.57 | 2.65 | 3.12 | 5.08 | 4.78 |
| Dec 2025 | 2.42 | 2.39 | 2.81 | 3.56 | 2.56 | 3.04 | 5.14 | 4.78 |
| Mar 2026 | 2.60 | 2.59 | 2.73 | 3.21 | 2.71 | 3.19 | 5.18 | 4.92 |
| Jun 2026 | 3.68 | 2.87 | 2.72 | 2.94 | 2.81 | 3.10 | 5.50 | 5.25 |
Test of alternative inflation expectations question wording
21 May 2026
During the June 2026 quarter, we tested an alternatively worded CPI inflation expectation question with the aim of clarifying that at each time horizon we are seeking an annual percentage change. The alternatively worded question was tested using a 25% subsample of the overall selected sample (the test group).
The remaining subsample (75% of those selected) were asked the question as currently worded (the control group). We estimated population mean expectations using the test and control subsamples and found similar mean CPI inflation expectation estimates between the two treatment groups (well within the 95% confidence intervals) suggesting that the question wording improvements had only a minor impact on overall results.
Further detail on the question wording test and the results is available in this document: Tara-ā-Umanga Business Expectations Survey: Test of alternative inflation expectations question wording
Changes to M15 Data File
21 May 2026
During the June 2026 quarter, we implemented changes to some of the names of existing variables in the M15 data file for clarity and included two new variables to identify the question and time horizon dimensions. The description of the variables published in the M15 data file (available below in the Background notes) has been updated to reflect these changes.
Immaterial revisions to the measures of uncertainty for the weighted mean have been published for the September 2024 quarter (corresponding to the second pilot of the development phase of the survey) due to minor updates to the population counts used in the calculation of the sample design and employment size weights. The updates resulted in revisions of no more than +/- 4 basis points to the standard error of the weighted mean, with negligible impact on confidence intervals and relative standard errors. There were no revisions to the weighted mean or weighted median results for September 2024, and no other quarters were impacted.
View all previous Business Expectations Survey Special notes
Purpose of this Survey
The primary purpose of the Tara-ā-Umanga Business Expectations Survey is to better understand the economic outlook held by key decision makers from a broad-industry sample stratified by business size and industry. Business expectations about future inflation play an important role in determining inflation because firms reflect their expectations in their price- and wage setting decisions. The results of this survey also provide insight into whether firms believe the Reserve Bank will meet its objective of low and stable inflation and support our forecasting, policy development, and research activity.
It should be noted that while this survey represents a significant uplift in our expectations data, more observations are needed (beyond the short historical timeseries available at launch) to enable us to estimate the relationship between these data and ultimate inflation outcomes. We anticipate that the results of this survey will become key statistical series used by central banks, researchers, financial institutions and commentators.
Survey Methodology and Coverage Characteristics
The primary collection mode is a web questionnaire emailed to respondents. Sampled businesses selected to participate in the survey are contacted by phone to recruit them into the survey panel.
The survey is designed to take less than 10 minutes to complete, and participation is voluntary.
Sample design
We have collaborated with Stats NZ to draw a stratified probability sample from the Statistical Business Register and therefore we are able to use probability theory to make statistically valid interferences about a wider population beyond those responding to the survey. On a quarterly basis, we receive an updated sample from Stats NZ to ensure that the survey is representative of the contemporary population of businesses and to mitigate the impact of respondent attrition on response rates.
The sample is partitioned into non-overlapping stratum which includes three employment-size strata and five industry strata.
The three employment-size strata are Large (100+ employees), Medium (20-99 employees), and Small (6 – 19 employees).
The five industry strata include Primary, Manufacturing, Construction, Retail, and Other, with these industry strata created by grouping the 19 top-level industries in the Australian and New Zealand Standard Industrial Classification System (ANZSIC) 2006. The grouping was created to ensure sufficient sample size for each stratum and the five industry strata were designed with consideration for the frequency of price changes and the industries that would be explicitly identified in the survey results.
Survey scope
The target population is all businesses (enterprises) classified as non-financial business enterprises, financial business enterprises, general government institutions, and non-profit institutions serving households. Micro businesses with less than six employees are excluded from the target population.
The businesses selected in prior quarters are considered to remain ‘selected’, and therefore ‘in-scope’ for subsequent quarters. This provides statistical validity to re-surveying businesses that stated a willingness to participate again and creates a panel element to the sample design.
The core questions of the survey cover expectations for inflation, wages, and unemployment at various time horizons and respondents are asked to provide quantitative expectations for these variables.
Since the first pilot survey in April 2024, the Business Expectation Survey fieldwork was carried out by Research New Zealand – Rangahau Aotearoa. The research provider was selected through a competitive procurement process.
Methodology used to calculate the series on the M15 table
The parameter of interest for core questions of the Tara-ā-Umanga Business Expectations Survey is an economic-size-weighted mean. As the sample design is a stratified random sample, sampling weights are required to create statistically valid population estimates given the non-ignorable sample design (businesses are selected with unequal probabilities of selection as the sampling fraction varies across strata) and the need to weight the expectations of larger businesses more than smaller ones (given their unequal contribution to the overall economy).
Economic-size weighted population mean
The economic-size weighted population mean ![]() is calculated as follows:
is calculated as follows:

Where,

and,

Nₕ is the total number of businesses within stratum h in the population; nₕ is the total number of businesses within stratum h in the sample;
yᵢ is response from business i for parameter y
aᵢ is the design weight, representing the reciprocal of the inclusion probability of business i.
Sᵢ is an employment size weight, representing the economic size of business i defined using strata population employment proportions.
Xₕ is the population total of the auxiliary variable (employment) in stratum h;
Sample design weight: Considering the sample design weight, aᵢ, an estimator of this type is common practice for stratified business surveys with a non-ignorable sample design (Smith, 2013). It is variously known as an expansion, number-raised, or Horvitz-Thompson estimator (Horvitz and Thompson, 1953).
Employment size weight: The employment size weight, sᵢ, reflects the fact that even if we surveyed every business in New Zealand (conducted a census) we would still wish to weight the expectations of larger businesses more than smaller ones.
This type of economic-size-weighting is common practice for surveys of inflation expectations, such as Cleveland Fed’s Survey of Inflation Expectations – SoFIE (Federal Reserve Bank of Cleveland, 2023) and the Bank of England’s Decision Maker Panel (Bloom et al., 2017).
The use of population (rather than sample) totals in sᵢ is advocated by Bloom et al. (2017), as this allows the results to be representative but prevents very large individual businesses dominating the overall results.
Non-response adjustments
Survey non-response has the potential to bias survey estimates if the views of the non-respondents systematically differ from those who do respond to the survey. While we seek to minimise non-response through survey fieldwork, we also apply the following statistical non-response adjustments to further minimise the potential for non-response bias:
Unit non-response: We replace the number of selected businesses, nₕ, with the number of responding business, nₕ*, in the sampling weight. This adjustment implies that non-responding businesses are best represented by similar businesses who did respond in the same design strata.
Item non-response: Given not all respondents report a numerical answer for every question (due to partial completions and “no opinion” responses), we also use the number of responding businesses separately for each question. This question-by-question approach is used in the Cleveland Fed’s Survey of Inflation Expectations (Federal Reserve Bank of Cleveland, 2023).
Outlier treatment
As the parameter of interest is the economic-size-weighted mean, untreated outliers may have a big effect on the estimation of population statistics due to the amplifying effect of weights that can result in population estimates being heavily influenced by only a few responses. The use of Winsorisation is common practice for outlier treatment in business surveys.
We have used two-sided, Type I, Winsorisation, where outlying values are adjusted to the value of a cut-off. This has the favourable property that businesses are still included in the sample, rather than excluded entirely. We can express this method as:
Outlier treated response:

where,
Kᵤ and Kₗ are upper and lower cut-off values which are the top and bottom 2% of the distribution of response for each question.
Economic-size weighted population median
To help users of the Tara-ā-Umanga Business Expectations Survey understand the dispersion and central tendency of business expectations for core questions of the survey, we also publish an economic-size weighted population median.
The economic-size weighted population median ![]() is calculated as follows:
is calculated as follows:
For n responses (ordered by value) y₁, y₂, ... , yₙ with weights w₁ ,w₂, ...wₙ the weighted median ![]() is the response yₖ satisfying
is the response yₖ satisfying
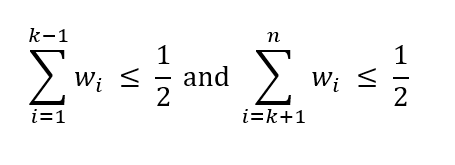
where,

wᵢ is the combined sample-design and economic-size weight (as used for the published weighted mean statistics), comprising the design weight, aᵢ, and the employment size weight, Sᵢ, (with both unit non-response and item-non-response adjustments applied as described above) as a proportion of the total weight.
As the median is robust against outliers, no outlier treatment is applied to yᵢ in our estimation of the population median.
Periodicity
This survey is conducted quarterly with fieldwork beginning in January, April, July and October.
The survey is sent to the field the day after the consumers price index (CPI) data is released by Stats NZ with a short field window (typically 6 working days).
Timeliness
We release data in the second or third week of the second month of the reference quarter.
Access by the public
Statistics release calendar
The statistics release calendar provides a long-term plan of scheduled releases. We update and release the calendar on the first working day of the month.
View the statistics release calendar
Integrity
Terms and conditions under which official statistics are produced, including confidentiality of individual responses
The results of the survey represent expectations held by the respondents and in no way represent our views or forecasts.
To preserve anonymity, each respondent is assigned a unique numeric code by Research New Zealand – Rangahau Aotearoa. Respondents are given the option at the end of the survey to provide their consent to be identified in the survey results that we receive from Research New Zealand – Rangahau Aotearoa for the purpose of more in-depth analysis of the results.
The results of the Tara-ā-Umanga Business Expectations Survey are only published in aggregate, and we will not publish any summary statistics for any employment-size or industry stratum with 3 or fewer responses to preserve respondent confidentiality. The Tara-ā-Umanga Business Expectations Survey (M15) data file contains a variable (“suppression_required") to indicate whether results have been supressed for confidentiality.
Revisions and advance notice of major changes in methodology
We publish special notes for any major changes in methodology. Respondents are notified of changes to the survey questionnaire prior to them participating in the current survey. For example, this may include an explanation of a new or replacement variable for which the respondent's expectation is sought.
Quality
To help users of the Tara-ā-Umanga Business Expectations Survey results understand the degree of confidence in the outputs, the M15 data file contains several common measures of uncertainty for the economic-size weighted mean (“weighted_mean”):
- Standard Error (“standard_error_wtd_mean”)
- Lower Bound of the 95% Confidence Interval (“lower_confidence_interval_wtd_mean”)
- Upper Bound of the 95% Confidence Interval (“upper_confidence_interval_wtd_mean”)
- Relative Standard Error (“relative_standard_error_wtd_mean”)
We publish these measures of uncertainty as a guide to help interpret the precision of our population estimate, for the economic-sized weighted mean, which is subject to statistical uncertainty (“sampling error”) resulting from our use of a sample survey, rather than a census of all businesses. The variable names in the data file are included above (and below) in parentheses.
We also publish the number of responses for each stratum (“item_response_count”) and indicate estimates with moderate and high uncertainty based on applying the following criteria to the relative standard error (RSE):
- Moderate Uncertainty: RSE greater than or equal to 20% but less than 50%
- High Uncertainty: RSE greater than or equal to 50%
The indicator variables (“moderate_uncertainty_flag_wtd_mean” and “high_uncertainty_flag_wtd_mean”) in the M15 data file are equal to 1 if the above criteria are met for a given estimate.
Data processing guidelines for responses from related businesses
The stratified probability sample is selected at the “kind-of-activity unit” level from Stats NZ’s business register as described above in the background notes. As sampled businesses are contacted by phone to recruit them into the survey panel, when we identify related businesses at the “kind-of-activity unit” level that share a single price setting decision-maker we perform limited imputation in cases of non-response.
Validity checks using related surveys
We are progressing towards a three-survey approach to measuring expectations, with surveys covering households, experts, and businesses. The Tara-ā-Whare Household Expectations Survey (H1) has been published quarterly since March 1995 and the Tara-ā-Pūkenga (Expert) Survey of Expectations (M14) has been published quarterly since September 1987. Given the importance of expectations for monetary policy decisions, running our own surveys provides us with complete control and certainty regarding the survey content, timing, and quality of results.
Other independent estimates of inflation expectations that can support statistical cross-checks and provide assurance of reasonableness are published in the ANZ Business Outlook Survey and NZIER Quarterly Survey of Business Opinion
NZIER Quarterly Survey of Business Opinion
References
Bloom, N., Bunn, P., Milzen, P., Smietanka, P., Thwaites, G., and Young, G. (2017). Tracking the views of British businesses: evidence from the Decision Maker Panel. Quarterly Bulletin 2017 Q2 article. June 2017. Available from www.bankofengland.co.uk
Horvitz, D. G., and Thompson, D. J. (1953). A generalization of sampling without replacement froma finite universe. Journal of the American Statistical Association 47 (283): 663-685.
Federal Reserve Bank of Cleveland (2023). Detailed Methodology for the Survey of Firms’ Inflation Expectations (SoFIE). Available from https://www.clevelandfed.org/-/media/project/clevelandfedtenant/clevelandfedsite/indicators-and-data/survey-of-firms-inflation-expectations/sofie-detailed-methodology.pdf
Smith, P. (2013). Sampling and Estimation for Business Surveys. In Snijkers, G., Haraldsen, G., Jones,J., and Willimack, D. K (Eds.) Designing and Conducting Business Surveys. Hoboken: John Wiley
The Tara-ā-Umanga Business Expectations Survey asks respondents questions on their expectations for annual CPI inflation, annual wage inflation, and the annual unemployment rate at various time horizons and respondents are asked to provide quantitative expectations for these variables.
In the Tara-ā-Umanga Business Expectations Survey (M15) data file, we publish the economic-size weighted mean (“weighted_mean”) and median (“weighted_median”) for each question (“statistic”) at each surveyed time horizon (“horizon”) on an aggregate level and for each industry strata (“industry”) and employment-size strata (“business_size”).
The questions asked can be found in the survey questionnaire.
View the survey questionnaire.
Annual CPI Growth
The consumers price index (CPI) as published by Statistics New Zealand for all groups is the most widely recognised and understood measure of inflation. We ask respondents for their expectations of the annual percentage change (the headline inflation rate) (i) one-year ahead, (ii) two-years ahead, (iii) five-years ahead, and (iv) ten-years ahead from the last known actual CPI inflation published by Stats NZ.
We publish the economic-size weighted mean and median for each of these four surveyed time horizons on aggregate (where “industry” and “business_size” both equal “All” in the M15 data file) and for each industry strata (“industry”) and employment-size strata (“business_size”).
Stats NZ: Consumers Price Index (CPI)
Annual Wage Growth
Average hourly wage rates (private sector, ordinary time) as reported in Statistic New Zealand’s Quarterly Employment Survey, is a commonly used measure of private sector salary and wage movements. We ask respondents for their expectations of the annual percentage change in the average hourly wage rates for (i) one-year ahead and (ii) two-years ahead.
We publish the economic-size weighted mean and median for each of these two surveyed time horizons on aggregate (where “industry” and “business_size” both equal “All” in the M15 data file) and for each industry strata (“industry”) and employment-size strata (“business_size”).
Stats NZ: Quarterly labour market statistics
Unemployment Rate
The unemployment rate as measured and reported in Statistic New Zealand’s Household Labour Force Survey (HLFS) is based on the International Labour Organisation standards, and is the only measure of the unemployment rate in New Zealand recognised as being internationally comparable. Individuals are designated under this definition, as being unemployed only if they are actively seeking work and are available to start work.
We ask respondents for their expectations of the unemployment rate as measured in the HLFS for (i) one-year ahead and (ii) two-years ahead.
We publish the economic-size weighted mean and median for each of these two surveyed time horizons on aggregate (where “industry” and “business_size” both equal “All” in the M15 data file) and for each industry strata (“industry”) and employment-size strata (“business_size”).
Stats NZ: Household Labour Force Survey (HLFS)
Symbols and conventions for summary table
| Symbol or convention | Definition |
|---|---|
| 0 | Zero or value rounded to zero |
| - | Not applicable |
| .. | Not available |
| bold | Revised/new |
| italics | Provisional |
| Light grey background | Historical |
General notes
- Individual figures may not sum to the totals due to rounding
- Percentage changes are calculated on unrounded numbers
- You are free to copy, distribute and adapt these statistics subject to the conditions listed on our copyright page.