A speech delivered to the National Property Conference 2022
With thanks to Punnoose Jacob, Matthew Brunton, Jonathon Adams-Kane, Andrew Coleman, Cuong Nguyen, and other colleagues from the RBNZ, the New Zealand Treasury and the Ministry of Housing and Urban Development
Thanks for the opportunity to speak today on the critical issue of housing here in Aotearoa-New Zealand.
Housing matters because everyone needs a place to live – it is fundamental to our wellbeing. It also matters because housing is by far the most common and most valuable investment for many New Zealanders.
On the flip side, rent and mortgage costs are also the biggest expenses for many households. Building houses is a big source of jobs in our economy too – tens of thousands of people earn their livelihoods working in residential construction.
The housing market is also a key link between the real economy and the financial system in New Zealand, with home loans dominating the balance sheets of commercial banks.
So, understanding how the New Zealand housing market works is really important for us at Te Pūtea Matua, the Reserve Bank of New Zealand. Recent changes to the Remit for monetary policy – which tells us what we need to pay attention to in making interest rate decisions – also require us to assess the impact of our decisions on house prices.
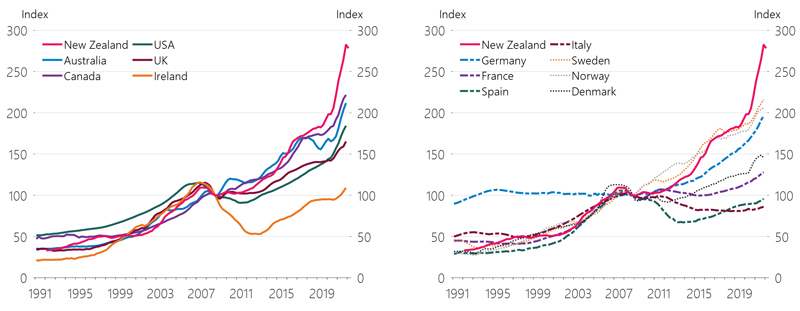
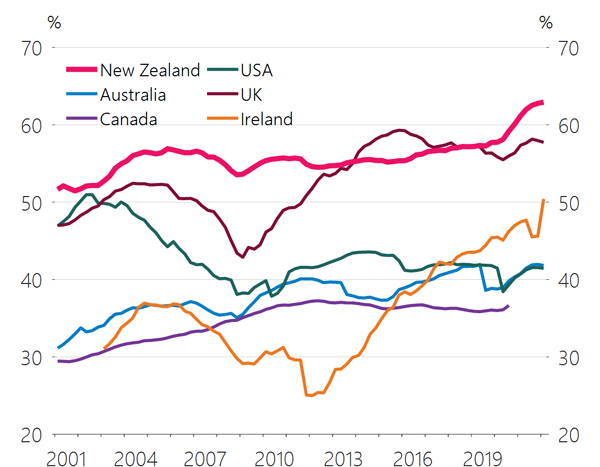
One thing seems clear from the get-go – housing demand has tended to outstrip housing supply in New Zealand. As a result, housing has gone from being abundant and reasonably affordable to being scarce and prohibitively unaffordable for many, with house price inflation here among the highest across OECD countries over recent years (Figure 1).
While this has generated strong returns for house owners, it has also increased the wealth gap between New Zealanders who own houses and those who do not. Kiwis who own houses – often older New Zealanders – have increased their wealth, while those who do not own houses have seen accommodation costs steadily increase, with many prospective younger first-home buyers struggling to buy a home of their own.
At the extreme, the number of families living in emergency housing such as motels, has increased strongly in our country and the OECD reports that we have one of the highest rates of homelessness across member countries.1
Even though the market has recently turned, with house prices down over the first half of 2022, house prices remain at very high levels in absolute terms and relative to incomes.
Today, I’m going to discuss various reasons for the supply-demand mismatch that has led to such high house prices. I will use insights from recent Reserve Bank research to steer us through some of the complexities of the New Zealand housing market and to better understand it.2
Figure 1: Nominal house prices
Why People Buy Houses
Shelter is a critical human right. So, more people imply a need for more houses. But population growth is not the only driver of housing demand. For example, lower interest rates create extra buyer demand by allowing people to service a bigger mortgage with the same repayment. The way returns from housing are taxed also impacts on housing demand.
A Growing Population Needs More Houses
The housing stock in New Zealand has not kept up with population growth – the number of dwellings per person in our country has fallen since 2011 up until the beginning of the COVID-19 pandemic (Figure 2). In contrast, dwellings per person have increased in most other OECD countries over this period (Figure 3).
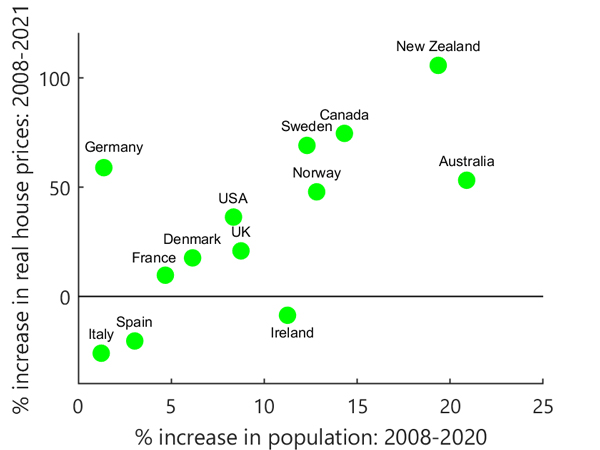
In part, this reflects very strong population growth in New Zealand up until the beginning of the pandemic. Since the Global Financial Crisis (GFC), New Zealand has experienced almost the highest rate of population growth across the OECD, in large part off the back of a migration boom. Since we have failed to build enough houses for a growing population, it is not altogether surprising that we have had the largest increase in house prices (Figure 4).
This reflects one of the underlying issues that New Zealand faces: our supply of new houses has not kept up with the demand for housing coming from a growing population. However, this is by no means all of the story.
Figure 2: Dwelling availability in New Zealand
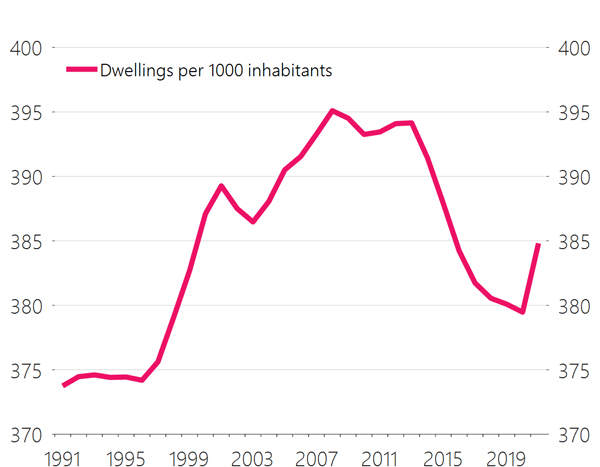
Figure 3: Dwelling availability (per 1000 inhabitants) in the OECD
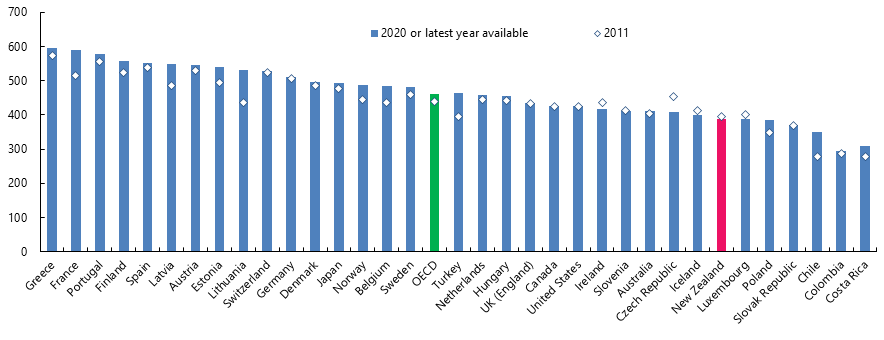
Figure 4: Growth in house prices and population since 2008
Interest Rates – The Long and Short of It
Interest rates are another key driver of housing demand. For example, lower mortgage rates mean people can borrow more for a given level of income, making it easier to fund a house purchase. This stimulates a higher demand for better-quality properties, pushing up prices, if more supply does not come on stream.
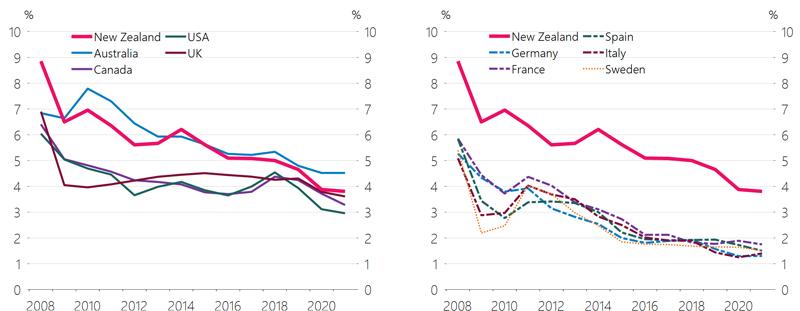
Interest rates fell steadily after the GFC, both in New Zealand and around the world. For example, while a new bank customer in New Zealand could lock in a two-year mortgage at almost 9% in 2008, they could get the same mortgage for just under 4% in 2021 (Figure 5).
A wide-range of factors influence interest rates. Monetary policy has short-term, temporary impacts on interest rates over the course of the business cycle. Central banks control inflation by moving policy interest rates either side of the so-called “neutral” interest rate to ‘lean against’ the business cycle. That is, to slow things down in a boom and to stimulate activity in a slump.
The neutral interest rate is the interest rate at which inflation is low and stable and employment is at its maximum sustainable level.
The long-term decline in the cost of borrowing shown in Figure 5 reflects a drop in the neutral interest rate over the course of decades rather than over the business cycle. Best estimates of the neutral rate show it has fallen across OECD economies over many decades, and the GFC triggered an even sharper dip.3
Here in Aotearoa, Reserve Bank estimates of New Zealand’s neutral rate shows a 3-percentage point drop since the mid-2000s.
There are a host of possible reasons why neutral interest rates have fallen over recent decades. For example, with people living longer, savings have increased to pay for longer retirements. Also, the hardships that followed the GFC also caused people in many countries to spend less, building up precautionary savings to insure against income uncertainty.4 With relatively weak productivity growth since the GFC, the returns on investment and demand for investment funding have been low.5
Overall, these and other forces buoyed global savings rates, creating vast pools of capital that have flowed through liberalised international financial markets to finance investment needs. In short, a world-wide savings glut is likely to have lowered neutral interest rates.
As global neutral rates declined, borrowing costs dipped to historical lows, and house prices increased in many countries. In New Zealand, as in many other countries, falls in the global neutral interest rate played a dominant role in the long-term increase in house prices, dwarfing the effects of changes in shorter-term interest rates and rents.6
This is not to say that temporary cyclical interest rate changes – driven by Reserve Bank monetary policy – are not important. The New Zealand experience is that a temporary easing of monetary policy (for example) leads to a temporary increase in house prices.7 However, the more persistent upward trend in New Zealand house prices is mainly driven by the persistent decline in the neutral interest rate, which has, in turn, been affected by global forces.
Figure 5: Mortgage interest rates in selected countries
Tax Settings That Favour Housing
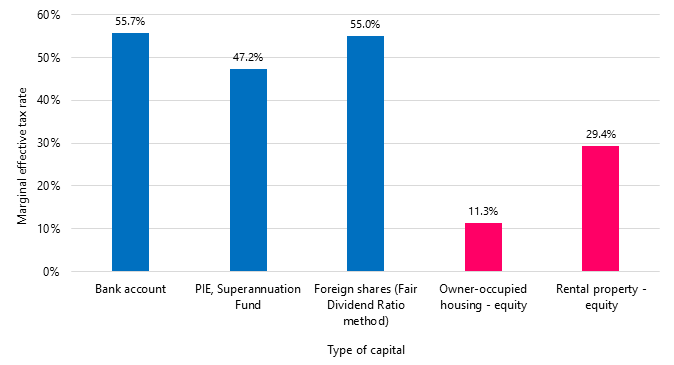
Our tax system may have also contributed to higher house prices over recent decades. Figure 6 is taken from the Tax Working Group (2018) and shows that our tax system has historically favoured housing as an investment asset.
Capital gains on housing are often not taxed, whereas other forms of income are. Imputed rent (the rent owner-occupiers effectively pay themselves) is not taxed whereas other forms of investment income are. And GST is charged as a lump sum when a house is built, rather than on the flow of housing services as they are consumed, be that via rent or owner occupation.
These tax distortions that favour housing become more potent when interest rates are low, amplifying the effects on house prices. So, as interest rates fell between 2002 and 2021, it is likely that the upward impact of tax settings on house prices increased.8
If the tax system had been more ‘neutral’ in its treatment of housing, house price increases would have been milder over the two decades to 2021 as interest rates fell.
Of course, a fully non-distortionary neutral tax system is merely an economist’s fantasy; indeed, there are practical considerations that influence the design and implementation of tax systems. Nonetheless, understanding the impacts of tax distortions – and their interactions with other relevant factors such as interest rates – on the housing market is important for understanding house price dynamics.
Figure 6: Marginal effective tax rates on investments in New Zealand (2018)
Constrained Housing Supply
Higher housing demand will have a much smaller impact on house prices if new homes are built quickly to meet that demand. For example, our analysis shows that house prices are less sensitive to temporary changes in interest rates in areas of New Zealand where new homes are built relatively more quickly to meet demand.9
A recent report by the New Zealand Infrastructure Commission finds that the response of house prices to population growth between the late 1970s and the late 2010s, was about 4 times lower than what it was from the late 1930s to the late 1970s.
It would seem that consistent with rapid house price inflation, the supply of housing over recent years has been slower to respond to increased demand. There are two key components to housing supply: the house itself and the land on which it is built.
Land Supply
Land markets in New Zealand are critical in explaining high house prices. If the space for new housing – both up and out – is restricted or difficult to access, increased housing demand gets captured as changes in the price of land, rather than as more houses. On the other hand, when there is space available for new housing, increased demand will see more houses being provided with more modest impacts on prices.
Modelling by the New Zealand Infrastructure Commission (2022) shows that changes to urban planning policies that constrained land supply explain much of the acceleration in house prices in recent decades.10 Similar results on the effect of land-use regulation are echoed by Lees (2019), who studies a number of cities in New Zealand.
Previous work for the Ministry of Business Innovation and Employment and Ministry for the Environment showed that land within the urban boundary can be $200 to $300 per square metre more expensive than surrounding rural land. The steep difference in prices across the urban boundary means that land-use regulation has an important impact.
Construction Costs
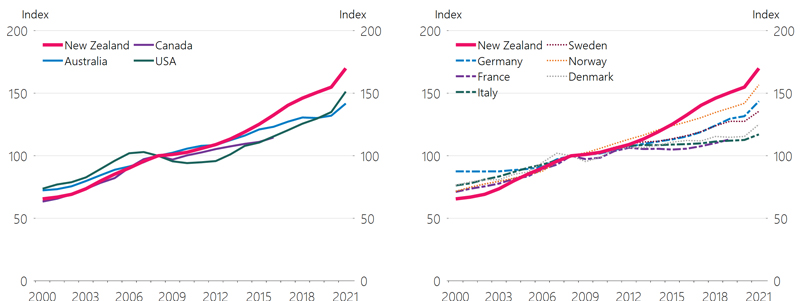
World Bank data show that construction costs in New Zealand were 16% higher than in Australia and about double the OECD average in 2017. In 2012, the New Zealand Productivity Commission wrote a Housing Affordability Inquiry also showing that building costs were high here relative to other countries. Despite being high already, construction costs have also been increasing faster in New Zealand than in other countries since the GFC (Figure 8). This all strongly suggest that house building in New Zealand is an expensive business.
There are no doubt many reasons why building costs are so high here. Part of the reason could be that the manufacture and distribution of building materials – which account for almost half of construction costs – take place in industries that are dominated by one or a small number of large firms. In addition to weak competition, some building supply businesses are likely to be relatively unproductive and to produce below minimum efficient scale.
Figure 8: Nominal construction cost indices
‘Sustainable’ House Prices and Monetary Policy
What do these and other fundamental drivers of the housing market mean for house prices? To help answer this question, Reserve Bank researchers have estimated the level of ‘sustainable’ house prices consistent with market fundamentals, such as the cost of alternatives to owning a property, the longer-term outlook for interest rates, and expected future supply and demand conditions.11
Not surprisingly, given weaknesses in our ability to provide enough space for new housing for a rapidly expanding population, the tax system, and the decline in neutral interest rates internationally, ‘sustainable’ house prices have increased strongly in New Zealand over recent years (Figure 9). This increase in ‘sustainable’ house prices reflect the fact that market fundamentals have been key in pushing up actual house prices over the last few decades.
Actual house prices can and do deviate from ‘sustainable’ house prices as a result of short-run influences, such as monetary policy and the ‘animal spirits’ of market participants. Monetary policy influences how house prices evolve around the sustainable level but is unable to keep house prices persistently above or below their sustainable level.
Since the beginning of the COVID-19 pandemic in 2020, actual house prices have been above their sustainable level. Exceptionally low interest rates coupled with a “fear of missing out” would have contributed to this cyclical surge in house prices. In turn, stronger house prices supported consumer spending over this period through a wealth effect.12 This additional support to aggregate demand and spending in our economy played a key role in helping us avoid the worst effects of the pandemic on employment and income.
Importantly, ‘sustainability’ and ‘affordability’ are very different concepts. While sustainability is determined by fundamental drivers in the housing market, affordability is about where the cost of purchasing a house sits relative to the income of the home-buyer. Unfortunately, for many New Zealanders trying to buy a home, the current level of sustainable house prices – determined by market fundamentals – is still by no means affordable.
Figure 9: Comparing actual prices to the estimated sustainable levels

Safe as Houses?
With strong demand and constrained supply, rapid house price growth over the past 20 years or more has meant that residential property, as an investment asset, has delivered strong financial returns for New Zealand house owners.
With prices having been seemingly always on the up, it is no surprise that New Zealanders hold a relatively large share of their wealth in housing (Figure 10). The proportion of housing wealth in total wealth appears to be relatively high in New Zealand compared to other developed economies.13
Given large house price increases, research based on portfolio investment theory shows that investing in residential property has been the logical choice for many Kiwis.14 In New Zealand, given policy settings, it has been rational for investors to flock into the housing market.
Because housing can be leveraged, the flip side of strong investment in residential property is that mortgage lending makes up a larger proportion of commercial bank balance sheets compared to other OECD economies (Figure 11).
While investing in housing has been rational, the implications of channelling a very large share of our savings and debt obligations into housing goes beyond optimal portfolio theory. The housing market has become the default savings vehicle for many New Zealanders and the key source of collateral or security for borrowing by households and small and medium businesses.
It may also be that investing in housing in the hope of perpetually higher house prices may ultimately lead to a potential misallocations of resources that generates relatively little economic value.
Figure 10: The composition of New Zealand household assets
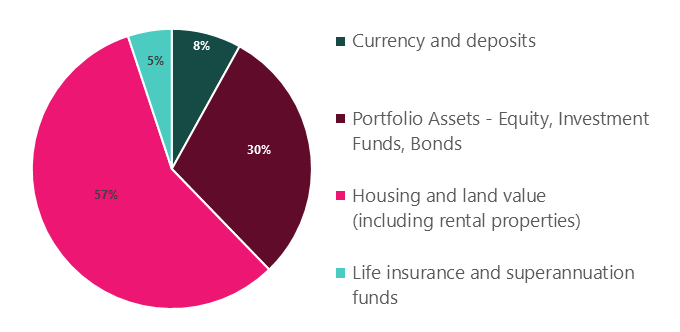
Figure 11: Lending in the residential property sector in the Anglophone countries
Where to From Here?
Over the years, the demand side of the New Zealand housing market was boosted by strong population growth, steadily declining neutral interest rates and a favourable tax system. The supply side, however, has been held back by strict land use regulations, and a construction sector prone to boom-bust cycles, while carrying very high building costs. Excess demand led to New Zealand’s experience with some of the highest house prices relative to income in the world.
A sense of ever-increasing house prices – along with a lack of other quality local investment alternatives – may have also distorted the investment options of New Zealanders. The share of housing on household balance sheets is very high and commercial banks hold a high share of mortgages on their balance sheets.
Rapidly increasing land prices may have also led to a transfer of wealth to people who owned land as prices were rising from landless younger people and future generations, who have to spend more to buy land.15 This means that they save less, reducing the amount of alternative capital they own and possibly lowering lifetime consumption and incomes.
Are these dynamics likely to continue in future? Since August 2021, the Reserve Bank has been tightening monetary policy, lifting the Official Cash Rate, to rein in inflation. This will likely see actual house prices move back towards sustainable levels that are more in line with market fundamentals. Indeed, in the May Monetary Policy Statement, we forecast a 15 percent decline in house prices from their peak, which would bring them roughly back to sustainable levels.
Over a longer time frame, there are reasons to think that some of the core market fundamentals that determine sustainable house prices may also be changing. On the demand side, as the pandemic slowly recedes and international travel restrictions unwind, many New Zealanders are heading overseas seeking new experiences.16 On the other hand, immigration is unlikely to return quickly to pre-pandemic levels, contributing to slower population growth overall.
In the tax space, the removal of interest deductibility and the introduction of a capital gains tax on sales of residential property owned for less than 10 years – the ‘bright lines test’ – will have closed some of the gap between the effective tax rate on housing and other asset classes.
At the same time, urban planning rules are being freed up to unlock more housing supply. The Resource Management Act is being replaced and the National Policy Statement on Urban Development directs councils to remove overly-restrictive planning rules and to enable higher housing density, which is a critical part of the solution.
In the construction sector, the Commerce Commission is carrying out a market study into whether competition for residential building supplies in New Zealand is working well and, if not, what can be done to improve it.
These changes are consistent with more houses being built and currently high building consents translating into more actual houses. They also imply that housing market dynamics in future are unlikely to be the same as in the past. Given the importance of housing in our economy and national psyche, this will be a huge change.
For several decades, we have traded houses among ourselves at ever-increasing prices in the belief that we were creating prosperity. But the tide may well have turned against housing being a one-way bet for a generation of Kiwis. We need to keep building a new approach to housing and economic prosperity in Aotearoa-New Zealand.
Footnotes
- 1 The number of families living in emergency housing increased from around 2600 in September 2019 to just over 4300 in May 2022. See Ministry of Social Development (2022) and Coughlan (2022). See also the OECD Housing Affordability Database for data on homelessness.
- 2 We are publishing 5 Analytical Notes in conjunction with this speech that set out what we have learned from this research.
- 3 Hong, S. and Shell, H. (2019). ‘The global decline of the natural rate of interest and implications for monetary policy’. Economic Synopses, Federal Reserve Bank of St. Louis, Issue 4, February.
- 4 Mody, A., Ohnsorge, F. and Sandri, D. (2012). ‘Precautionary savings in the Great Recession’. IMF Economic Review 60(1), pp.114-138.
- 5 Dieppe, A. (2020). ‘The broad-based productivity slowdown, in seven charts’. World Bank Blog, July 14.
- 6 Brunton, M. and Jacob, P. (2022). ‘New Zealand house prices and the decline in longer-term financing costs.’ Reserve Bank of New Zealand Analytical Notes AN2022/10.
- 7 For evidence for New Zealand, see two of the Reserve Bank’s Analytical Notes: Chadwick, M., Dasgupta, K. and Jacob, P. (2022), ‘Housing supply, house prices, and monetary policy’, AN2022/08, and Chadwick, M., and Nahavandi, A. (2022), ‘How does monetary policy affect the New Zealand housing market through the credit channel?’, AN2022/09.
For international evidence, see Williams, J. (2016), ‘Measuring the effects of monetary policy on house prices and the economy’, BIS Papers 88. Bank for International Settlements. - 8 This issue is discussed in detail in forthcoming analysis.
- 9 Chadwick, M., Dasgupta, K. and Jacob, P. (2022), ‘Housing supply, house prices, and monetary policy’, Reserve Bank of New Zealand Analytical Notes AN2022/08.
- 10 Urban planning in New Zealand relies on all manner of land use regulations; building height restrictions, minimum lot sizes, minimum parking requirements or heritage restrictions.
- 11 Brunton, M. (2021), ‘Measures for assessing the sustainability of house prices in New Zealand', Reserve Bank of New Zealand Analytical Notes AN2021/08.
- 12 For evidence for New Zealand on the consumption wealth effect, see de Roiste, M., Fasianos, A., Kirkby, R. and Yao, F. (2019), ‘Household leverage and asymmetric housing wealth effects- Evidence from New Zealand’, Reserve Bank of New Zealand Discussion Paper Series DP2019/01.
For US evidence, see Graham, J. and Makridis, A. (2022), ‘House prices and consumption: A new instrumental variables approach’, American Economic Journal: Macroeconomics (forthcoming). - 13 Cross-country comparisons of housing wealth are complex due to, for example, institutional differences and variations in definitions. Coleman (2019) has also reported a high share of housing wealth in total national wealth in New Zealand. Updates to this work suggest that the relevant numbers for New Zealand, Australia and the USA in early 2021 were 65%, 62.5% and 25% respectively. For more details on the methodology, see Coleman, A. (2019), ‘Taxing capital income in New Zealand: An international perspective’, University of Otago Economics Discussion Papers No. 1902.
- 14 Aguiar Carvalho, P., Baker, B., and Farquharson, A. (2022), ‘Housing as an investment asset in New Zealand: Looking at risk-adjusted portfolio choices’, Reserve Bank of New Zealand Analytical Notes AN2022/07.
- 15 See Feldstein, M. (1977). ‘The surprising incidence of a tax on pure rent: a new answer to an old question’. Journal of Political Economy 85(2), pp.349 – 360.
- 16 See Figure 4.12, Monetary Policy Statement May 2022.